
The Patchwork of MLSs: The Cost of National MLS coverage.
When we founded EveryState, our vision was to operate as a truly national real estate platform—one that could seamlessly serve customers in every market across the country. Our team is something of a unicorn, distinguished by the fact that we hold broker licenses in every U.S. jurisdiction (51 because of all 50 states and Washington D.C.).
Naturally, one of the most common questions we get from clients is about our coverage: Can we help them operate everywhere?
The answer is yes—but there’s an important caveat. Achieving 100% coverage comes with a significant cost. Every MLS we join requires a level of participation, compliance, and ongoing maintenance. The reality is, maintaining membership and MLS access in every single market—especially in regions where our clients don’t typically buy or sell homes—is an expensive and resource-intensive endeavor.
To help illustrate the landscape, here’s a rundown of how Multiple Listing Services (MLSs) align with metropolitan statistical areas (MSAs)—and what it really takes to build a platform that covers them all.
In the world of U.S. real estate, Multiple Listing Services (MLSs) are the unsung infrastructure that powers transactions—connecting agents, buyers, and sellers across regions. Yet, beneath the surface lies a fragmented landscape, where hundreds of regional MLSs define the rules and access to listings, often creating barriers for seamless national real estate operations.
The Dominance of the Few
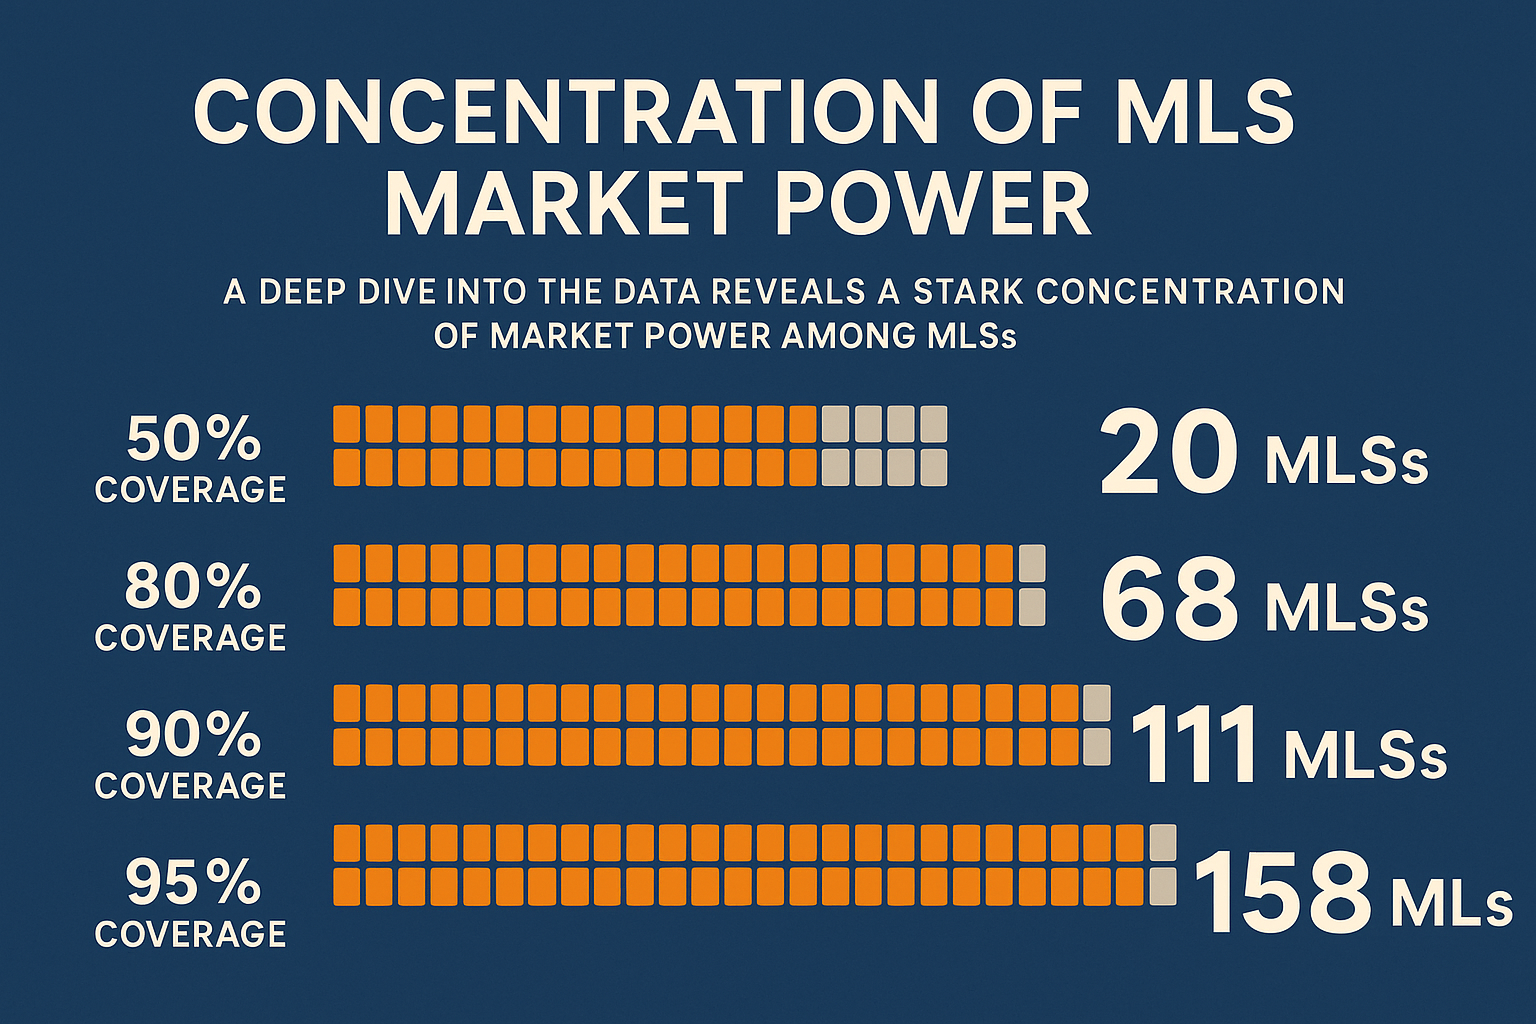
A deep dive into the data reveals a stark concentration of market power among MLSs. Just 20 MLSs are needed to cover 50% of the nation’s metropolitan statistical area (MSA) real estate market (by share of MSAT coverage). To reach 80% coverage, you’d need to include 68 MLSs—a significant jump. Attaining 90% coverage requires 111 MLSs, while reaching the elusive 95% threshold demands a staggering 158 MLSs.
This concentration suggests that while a few MLSs hold national sway, a long tail of smaller entities fragments the remainder of the market.
The Titans of the Market: Top 5 MLSs
At the summit of the MLS hierarchy, five heavyweights dominate, commanding the lion’s share of market coverage:
Their dominance reflects not just size but also strategic geography—covering high-density MSAs like New York, Los Angeles, and Chicago.
The Long Tail: The Bottom 10 MLSs
Contrast this with the other end of the spectrum: the bottom 10 MLSs, whose market shares are vanishingly small. Often hyper-local, these MLSs may serve a single county or niche community, but collectively, they add little to national coverage:
How Many MLSs Do You Really Need?
For a company seeking nationwide real estate access, here’s the hard reality:
Each incremental gain in coverage demands a disproportionate expansion in MLS relationships—an issue for aggregators, brokerages, and proptech platforms striving for scale.
The Remaining Sliver: The Final 5%
To bridge the gap from 90% to 95% coverage, you’d need to onboard an additional 47 MLSs. These remaining entities—while small—hold outsize importance for complete market access. What makes most business cringe, is that integrating with a small MLS the cost remains the same. It’s effectively the same cost to maintain an MLS that has 50,000 members as it does to maintain an MLS that has 500 members - in many cases it’s actually more expensive to maintain the longtail.